|
That year's Arisia came and went as
usual, and winter deepened considerably into late January and early
February. A "real" winter this time, unlike the previous year.
This would be a time for testing and observation; the first
brute test of the new thermal envelope even if I already knew there
were some bizarre factors thrown in by the basement conditions.
We got a week of single-digit night-time temps with daily highs in the teens, on the order of 50-plus heating degree-days per. That's pretty close to the "design conditions" for this area. I chose this time to try and re-create the whole-house test scenario I used to determine the old heat load with the oil furnace -- 60F setpoint, no rooms closed off, and hunkering in one warmer room with the space heater. And in this case, running the central heat purely off the resistance "toaster" controlled by the refitted old thermostat. I even shut down the outdoor compressor to remove the extra bleed from its crankcase heater, ran minimal to no ventilation for a while, and used main meter readings figuring that every bit of electric power entering the premises as the sole energy source would eventually turn into heat and thus be the best indication of net house load. Once again skipping a bunch of grubby numbers, I was coming up with around 200 btu/hour/degree-F for the energy input vs. envelope surface area, which when compared to the 300-something I'd determined before was actually a little disappointing. I expected to at least halve the heat loss or better, not just reduce it by a third. Something had to be off somewhere. I already knew that the dedicated HVAC meter might be reading a tiny bit high but no more than a couple of percent, and with the on/off beeper in place I was also timing a bunch of the heater runs as a cross-check. I went back over some of the oil-burner figures and added in rough guesswork about the additional electric base loads from back then, and saw a good possibility that I could have underestimated the old heat loss and/or furnace efficiency but even if that had been as much as 400 btu/h/F instead I was now only at about half that. It was already clear that there were some profound nonlinearities going on where the basement was concerned. With the 3 kw resistance coil only able to crank out about 10,000 btu/h where the heat pump could get closer to 20,000, the blower would have to run quite a bit longer and in fact in my hack-control mode I would simply keep the fan on the whole time -- which I realized was allowing a lot more air transfer between upstairs and the basement with its steady 52-degree slab and all of maybe R-4 on the cinderblock walls. But even going back to the regular heat-pump and making some assumptions about the running COP was giving me roughly the same figure. So here, as I predicted, that was going to screw up a bunch of my calculations not to mention give more overall genuine heat loss. This was going to require a lot more thought and probably some remedial measures. |
Mystery moisture
|
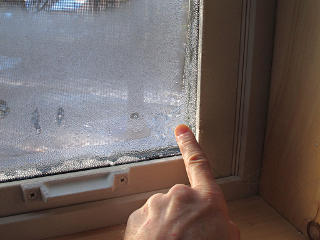
On the bright side, over the course of winter the window condensation
seemed to appear less and less even though the nights were still cold.
Perhaps it had been remaining moisture from summer in the house structure
itself, slowly diffusing out as the cold windows and other parts
attracted it. The inexplicable part was how the indicated RH inside
didn't change much -- stayed pretty much between 30 and 40 most of the
time, mostly regardless of outdoor temp and humidity conditions and
even after the window condensation pretty much ceased a couple of
months later.
Overall trends in this regard can sometimes take *years* to play out, even in a small structure, which is one reason building-science research drags on so long sometimes. Some case-studies show humidity graphs over like 5-year periods, to illustrate how envelope designs either worked long-term or gave rise to mold farms so slowly that occupants didn't realize why. If mine was starting on a long-term drying trend, it would be good but I wouldn't really know until *next* winter. |
Meter madness
|
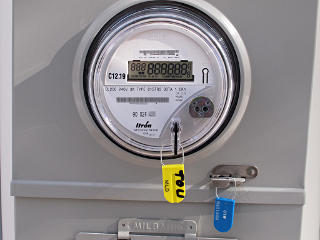
The meter czar from the power company and I had some good geeky discussions throughout the process, and one thing he recommended was switching to time-of-use billing as a means of a little cost-cutting. I was barely aware that such an option existed, especially for residential service, but with the advent of much smarter programmable meters across the industry it's become easy to implement. So a few days later I called to make that change, and the meter-guy was back out to the property to swap my meter over to this. It has a real-time clock and records an "A" rate and a "B" rate, swapping at the appropriate times, and evidently has a complete calendar including all weekends and holidays programmed into it covering something like 20 years out. Wow. |
|
The peak higher-rate hours are between noon and 7PM on weekdays only,
designed to encourage people to back down their cooling load during summer
afternoons -- but for heating season, that's precisely when I'd be needing
*less* power especially on sunny days. Since the house could now flywheel
for several hours with very little temperature change I simply programmed a
thermostat setback interval to encompass the peak time bracket. I asked
the power-company people how they can possibly make money on this, since
it seems that the peak rate is only appropriate for certain seasons --
the apparent answer is that they receive incentives from the actual
power suppliers to contribute to overall grid load-leveling so the more
they can get customers to help with that, the better.
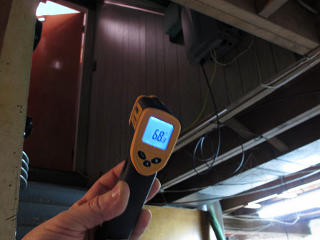
So now with a self-imposed cooldown period most afternoons, as well as some other random times when I simply didn't heat to see how fast different parts of the house would cool down anyway, I gathered more evidence that the basement was losing heat the fastest. Well, at least if it was appreciably above 50F or so down there, since it still wasn't clear if it was going mostly out through the walls or down through the slab. Probably some combination of both. The first and easiest way to limit heat loss is to lower the gradient across the area of interest. So I closed the single supply register down there, blocked off a big air-leaking hole between upstairs and down around where the bathtub drain is, and stopped up a few other obvious air-exchange points. Despite the presence of the old wall styrofoam the basement was *not* what I'd call superinsulated, so instead of trying to kid myself about its being fully conditioned space I could now just let it run significantly cooler than the rest of the house and hope the conductive loss down through the floor wouldn't be too bad.
|
|
Once I stopped fighting to keep the basement warmer things re-stabilized fairly quickly. The upstairs was easily maintained at my setpoint ... |
Studies in purple and orange
|
Thus when a friend rented an infrared imaging camera and offered to pass
it on to me after he was done with it, I seized the opportunity. While
the Despot's rental contract says "non-transferable" they weren't really
going to care who returned a tool after a one-day rental so I agreed that
I'd take it back the next morning. I zipped up to the friend's house
and had a look at what he'd observed around his own place, and then brought
the camera kit home and basically went nuts with it. So there are *lots*
of IR shots in this section, as it's all good data collection.
This camera was a FLIR i7, whose actual IR sensor is square and only 140 x 140 pixels. That's at the high end of that particular line; the i3 and i5 have even lower sensor resolutions and thus fields of view. The output images are interpolated up from there in a pretty reasonable way but still only 240x240 jpegs -- which happen to be perfect in my usage since all my thumbnails are 240 high anyway. Thus there aren't any "big-pix" associated with these. |
|
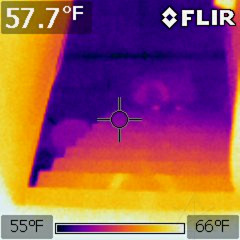
So now I could capture the disparity between upstairs and down in one
image, clearly showing the steps descending into the cold dark pit of
doom. Far more immediately
intuitive than waving the little one-eyed bolometer around. I could even
see my footprints where I'd recently stood at the bottom and walked up.
This is why the "ghost hunters" love these things. |
|
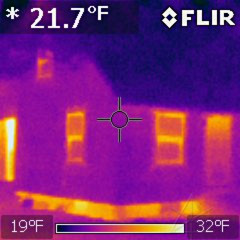
However, the first order of business was to go outside and take the typical exterior shots. And here's where my suspicions about the basement were immediately confirmed: while the rest of the house was a mostly cool purple with minor loss at the windows and doors, the foundation wall looked like a bright flaming orange rocket engine underneath it. Like the whole place was about to lift off like at the end of Rocky Horror. |
|
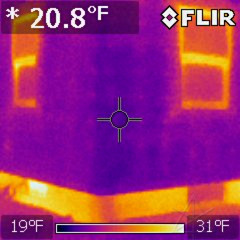
Closer in to the northeast corner, I could see the greater leakage of the
basement window [left] but that my #2 blockoff "sandwich" [right] was doing
better than the surrounding wall. That was nice to see.
Not that the basement wall or even that window were actually *warm* -- note the range endpoints, showing that everything was still somewhere less than freezing. But we're mostly looking for relative readings here. |
|
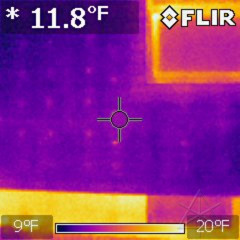
I could also clearly see where every screw-head was in the strapping,
and that's *behind* the siding! Each long Headlok was forming a tiny
thermal bridge to the inside structure, and you'd never know without
seeing this.
I found that the siding itself tended to read a bit cold, which might be expected since while there isn't a specific line item for vinyl under the materials emissivity list at Engineering Toolbox, the entry for "plastics" at 0.91 probably covers it. When taking any of these measurements, one must pay attention to the false-color scale endpoints because unless the range is locked, they keep automatically shifting around based on what's being viewed. |
|
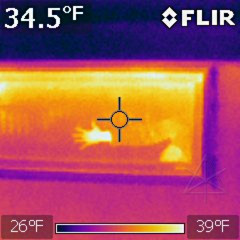
Some materials have both a direct emission component and a reflective component, particularly smooth surfaces. Here's a great example -- glass. This is the basement window with the glass on the outside toward me, and while I could pretty much read the outer temperature of the window itself there's an obvious partial reflection of my hot little hand in it. Shiny metal is the worst in this regard, basically acting as a mirror for infrared and visible alike, and even the finish on the metal roof reflects enough night sky that trying to shoot its temp from the ground is meaningless. |
|
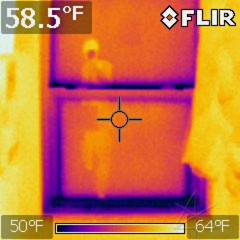
So viewing windows from inside often includes the viewer too. [Read: geek with a new techie toy.] This was an upstairs window that hadn't been shaded, showing the cooler frame parts but none of the characteristic drifty "plumes" that would indicate an actual air leak. It also confirmed how the Serious glass units themselves were blocking far more heat loss than the whole assembly -- something one must always consider when looking at claimed window R-values. |
|
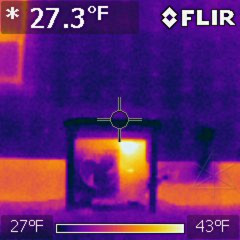
Around back, the effects of the HVAC compressor self-heating to keep
itself ready to run were clearly visible on the box around it.
Even though the compressor is in the bottom wrapped in padding, heat
tends to drift up through the whole compartment housing the valves and
electronics. It wasn't running just then, the fan at a standstill.
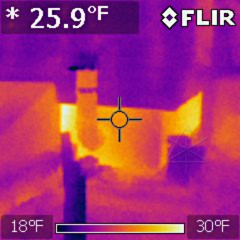
The HRV intake duct to the right of that was nice and chilly, of course, as given what it does it would usually be the same temp as the outdoor air. |
|
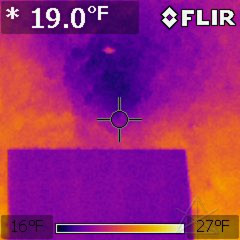
The HRV exhaust ran a little warmer but not inordinately so. If it wasn't for the HRV in the first place and this was an ordinary exhaust duct from the inside, this would have looked bright white when running. Here it appeared to be even cooler than the wall at the junction to the buikhead. |
|
The heat pump started up a little later, and out the window from above the hutch I could see the colder-than-ambient blast of air going out across the lawn. It's nice that the waste air gets sent directly *away* from the house, rather than washing up against the wall like would partially happen with an upflow unit. |
|
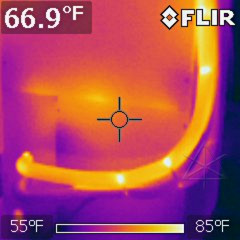
With the heat pump running, the refrigerant lineset at the air handler clearly showed the temp difference across the pipes right through their insulation. The half-inch or whatever of foil-faced fiberglass lining the air-handler box seemed to be doing an okay job of keeping most of the heat inside except perhaps around the cabinet joints. |
|
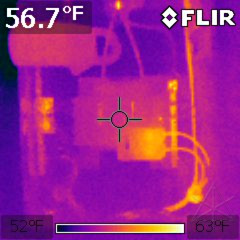
Even at only 7 or 8 amps, the circuit breaker and wires feeding the compressor were clearly carrying a higher load than anything else in the subpanel. Here's another great use for an IR imager: a one-shot evaluation of where heavy loads and/or loose contacts might be in an electrical panel. That's why one of the earliest uses of heat imaging was to detect bad connections in power substations -- nobody's going to exactly climb up there and stick a hand on those, y'know. |
|
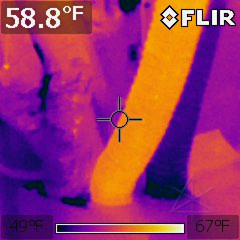
Even though the two inside HRV ducts are metallized plastic and likely to throw readings way off, I could easily see the difference from the air temps going through them. At the coldest outdoor temps, about the lowest I ever saw the incoming side of this go was 45F versus maybe 60F going out. Against single digits outdoors that's what even this unit's relatively meager 70-ish percent recovery efficiency delivers for incoming fresh air. |
Swirling snow
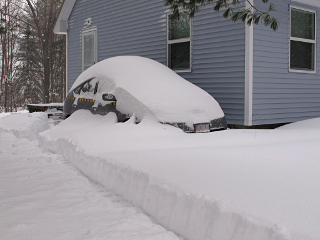
| As if Sandy hadn't been enough, the people over at the Weather Channel had apparently decided to start naming *all* the major storms that whirled their way across the country, summer or winter, and wrapping all kinds of sensationalism around each one. So the next thing the Northeast had to contend with was winter storm Nemo, which of course wasn't any different from typical nor'easter blizzard-like events that had come and gone over the last billion years or so ... but of course the foofaraw spilled over into the mainstream press which was all like "ZOMG this one's going to be SO HUGE go buy lots of bread and milk and toilet paper and then GET OFF THE ROADS!" backed up by various state agencies announcing that they'd penalize anybody who *did* go driving in some non-official capacity and sparking huge blogosphere flamefests about "fascism" vs. "let the plows do their jobs". Well, I didn't have to go anywhere and figured that even if we lost power I'd be thermally fine for a couple of days if needed. |
|
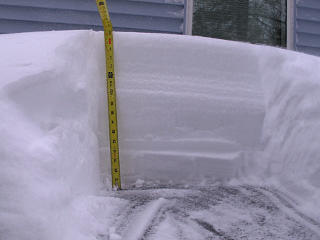
It was a pretty good dump, but in the end not quite as much as expected right around where I was. |
|
In various depth soundings around the yard I could only come up with a maximum of 17 inches, but other areas particularly to the south had gotten well over two feet. |
|
So there's possibly one downside of an air-source system; it's a little
vulnerable to snowstorms, and may take a minor efficiency hit from the
extra defrost cycles needed. But the wire grille really is placed rather
stupidly, and a couple of its mounting points are simply little plastic
teeth stuck *into* the coil fins at the bottom. That's clearly a suboptimal
design, and I already had plans to yank it off and build some sort of
replacement which would sit an inch or more away from the coil instead.
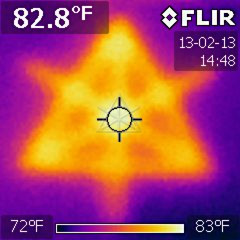
What's interesting is that from inside I can *hear* when the outdoor unit is iced up -- the fan starts roaring in a somewhat louder and harsher way. A quick peek out the window confirms how stopped-up it's gotten. Watching the limited sensor temps that I can at the 'stat also shows both the condensation and evaporation temps dropping way down as the coil clogs up and the system still evidently tries to maintain a delta of about 90F between the coils. Once it realizes that it can't, it goes into defrost again. At some point earlier in the season I fiddled with the outdoor-unit field settings and configured what I assumed was the "less frequent" defrost timing; in drier weather that did seem to eliminate some of the gratuitous cycles that weren't actually needed. Some elements of heating humor come to mind here. Real Men heat by burning wood they cut and split themselves. Real Geeks run heat pumps they hacked for energy-optimized running conditions. Which one freezes to death during a protracted power outage? But then which one asphyxiates from CO poisoning because he had a little too much Real Beer and set his stove dampers wrong before going to bed? Gotta have one! My brief adventures with the IR imager left a more profound impression than I expected, helped along even more by some of the diagnostics done on my visit to APC to discuss UPS design issues. I decided that it would actually be worth having one of these for any number of reasons, not the least of which could be running around *friends'* houses hunting down heat loss points as well as in my own. I poked around the FLIR online store and discovered that they had something of a clearance on a back-rev Extech unit. FLIR had evidently bought Extech's infrared division, if not all of it, and had been transitioning the line to their own branding as well as improving the units in general. For about the price of the really low-end "i3" I could get an earlier version "i5" with an 80 x 80 sensor instead of the 100 x 100 they have now. But I figured it would do, and went ahead and sprang for it. FLIR understands that even at the fixed-focus low end, these things are a bit of an investment and they send it along with a nice custom-fit Pelican style case with a generous extra compartment for whatever else you want to throw in there. So with the addition of my anemometer, outlet testers, circuit fox-n-hound and a couple of other widgets, it quickly turned into my portable home energy audit kit. I draw the line at owning a blower-door, though, since a cheap box fan and some cardboard can achieve the desired effect. |
|
The first challenge was to capture the obvious personal image to keep on
the SD card. Without reading ahead, how would you think this was done?
Remember, all the imager can see is heat -- ambient room light is irrelevant.
Answer: a black printout on a white piece of paper, warmed for a few seconds with an *incandescent* light bulb and then quickly shot before the absorbed heat difference dissipated. You can kind of see the chunkiness of the sensor pixels in the diagonal lines. |
|
|
|
But then it was right back into romping around the house with it. I was
still curious about the effects of the Reflectix shades -- did they actually
prevent any significant heat loss from inside? I left one window
upstairs shaded and one not for a few hours while heating normally inside,
and framed 'em both up from the backyard
for comparison. If there was a difference it was *very* slight, with the
mid-rail corners of the unshaded one on the right possibly just a little
warmer than the other.
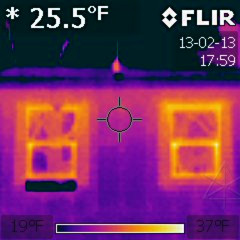
But on the exterior of the frame, there was likely another effect going on. Remember the missing snow around the windows after the blizzard, about six inches worth? Remember the meaty 2 x 6 bucks that the windows got installed into? Those are pretty visible in the thermal domain here, a couple of degrees warmer than the surrounding wall. Even with the thermal-break construction there's a bit less R-value between them and the sheathing, and of course they're coupled to the fiberglass window frame which gets some heat from inside. The black blotch under the left window is the UV-endurance setup, mostly reflecting night sky which basically has no emissivity and generally reads at "less than -40" [where C numerically meets F]. Same with the roof, although there's a hint of warmth from the stink-pipe. Sky and tree branches are also partially reflected in the window panes. The only real reason this works better at night is to make sure solar influence is off the structures in question and leftover daytime warming has dissipated. And it's much easier to see the display screen... | |
|
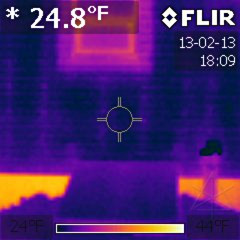
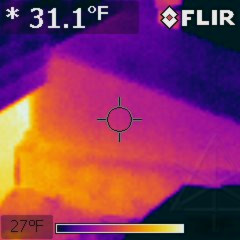
Looking along the basement bulkhead is deceptive: it almost looks like the bright basement wall is spilling light out against the side of the bulkhead. But that's the thermal gradient, most likely running out from the area right at the basement door frame. Despite the door's insulation and air-sealing, it still attaches to a big slab of wood at the edge and couples to the block wall where the old styrofoam ends. |
|
|
|
| Front door | Side door | |
|
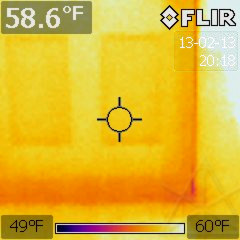
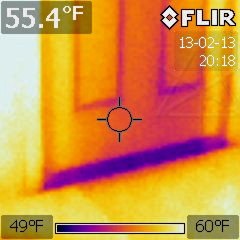
A quick comparison of the front and side doors from the inside showed that
my nasty old front door seemed to be doing better than the new side unit!
Where the insulating foam stops and there's just wood is fairly visible in
both -- even though it's the ugly external-XPS assembly on the front and
internal foam on the side. This was where range-lock on the imager was
useful -- note that the endpoints in both shots
are the same, and I was careful to let the imager settle down for a while
and stop doing so many uniformity recalibrations before capturing images.
Then I could freely swing around between views of different areas and have
the same visual scale across both.
The cold bottom edge at the side door is probably a combination of the metal sill parts to the exterior in contact with the subfloor, and the remaining likely air-sealing issues under the pan even if I'd mostly blocked the infiltration paths from there inward. | ||
|
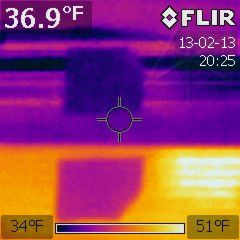
The test tape spots were still on said side sill assembly so here was the opportunity to see if the caulked separation between the halves made any difference. It did, just a little. The readings from the metal sill halves themselves have to be ignored -- they're shiny and reflecting everything, and since there's a slight angle change at the junction the inner one is reflecting the doorframe and me, and the outer one is mostly reflecting sky. That's why I'd attached the tape in the first place -- specific patches for IR measurement. |
More infrared fun
|
The rest of this gets a little [more!] gratuitous with the IR shots, but
it's all good education in realizing what one is looking at in the heat
spectrum and what causes some of the effects.
| |
|
|
|
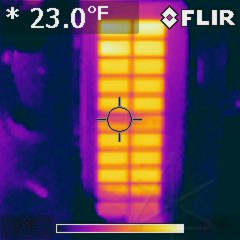
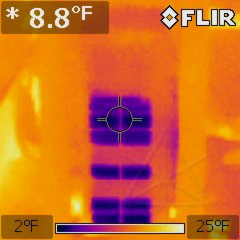
I caught the heat pump during a defrost cycle, and then later as it turned
back around and started cooling the outdoor coil again. Temperature changes
definitely progress through the coil as the refrigerant moves and it takes
a while for the entire coil to stabilize; the outdoor one seems to have
two parallel piping paths.
And the imager autoranging wound up making these almost the inverse of each other. Unfortunately, the firmware doesn't always make a wise choice about what color to make the endpoint numbers. | |
|
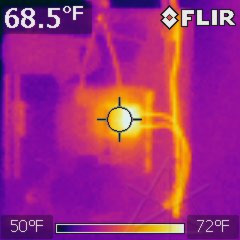
Later playing around with the "toaster" heater showed its circuit breaker *much* warmer than the one for the compressor had been; entirely reasonable since this pulls on the order of 13 amps. |
|
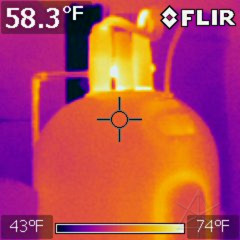
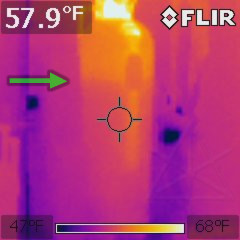
It's pretty obvious where the hot part of the water heater is; the pipes at the top have a couple of token pieces of insulation but it's a bit of a known leak point. If it helps heat the floor under the kitchen a little, that's okay. But I'd already gotten in the habit of turning the heater off during peak hours and the Marathon tank is so well insulated [2 inches of polyiso, in fact, didn't even realize that when I bought it!] I could easily forget to turn it back on for a couple of days. |
|
But here I had just recently turned it back on. To deliver some hot water quickly it uses the top element only until the upper part of the water is warm and can be drawn from, and then switches to the lower element to finish heating the rest of the tank. A little while after power-up I could easily see the stratification level at the upper element, right through all that insulation. |
|
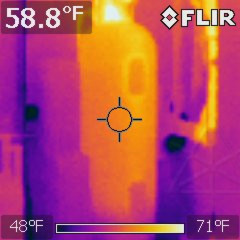
Later on, the whole tank had warmed up. The water right at the bottom
only ever gets lukewarm due to stratification above the lower element,
and that's where incoming cold water comes down the dip tube anyway.
This was about ten kilowatt-hours later. That's a lot of energy. If that much was put into the battery of an electric car, you could go 40 or 50 miles on it. |
|
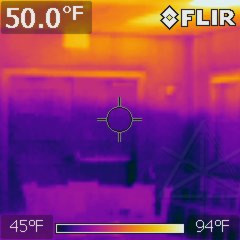
Water isn't all that can clearly exhibit thermal stratification. On a quick trip to do some circuit-location for a friend we were in a small dining-room sort of venue where they'd had the heat turned way down all night before we arrived. As the heat began to run and deliver air from the typical overhead diffusers that send the air horizontally along the ceiling, we could easily see the incoming body of warm air gradually filling in and pushing the cold air downward in a surprisingly uniform way. The lighter-pink blob in the lower left is a table and chairs, and beyond is a double-door to the outside with the fire-exit crash bar clearly visible. |
|
Back home, I could re-do some measurements at the HRV ducts; I already had some of those same tape patches on them for taking temperatures via the little IR gun. But here we see the visual difference, with the incoming fresh-air side still around a quite reasonable 45 - 50F despite it being much colder outside. At my minimal ventilation run rate the worst-case energy transfer via the exchanged air itself works out to a little over 500 btu/hr, which is decidedly nonzero and at times with the HRV running but not the main air handler I could definitely feel a little chill drifting out the return grilles upstairs. |
The water of ...
|
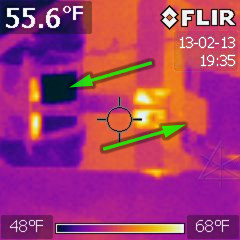
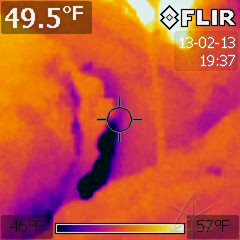
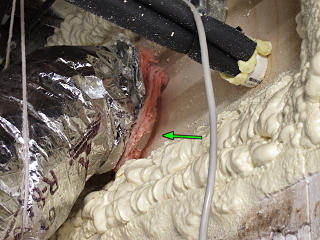
And perhaps that point would be sooner rather than later, as internal condensation wasn't the only hygrometric game going on with the HRV. While waving the IR-cam around the basement I spotted a very cold area right around the intake duct which I thought should be a little better contained, and upon investigating more closely found that the whole area was wet. |
|
That's because I'd done exactly what Dr. Joe tells us *not* to: left some fiberglass exposed to circulating air. I'd snugged it up against the panel reasonably well, but left a bit of its edge hanging out. The incoming duct was consistently cold, and as interior air filtered through the fiberglass it started condensing near the duct and then wicking its way around inside the outer duct wrap. And of course as soon as there was water contact to the cold duct, the R-value of the fiberglass was basically toast and the condensation area moved outward. So this assembly had been quietly soaking up interior moisture and accumulating it inside the flex-duct liner for most of the winter, and had also started soaking into my wood panel. |
|
Hmmm, maybe this is where my mystery water had been going...
I would have to take this whole mess apart and probably replace the entire intake segment, as by the time warm weather arrived and I'd actually be able to get to this it would probably be totally disgusting inside. For the interim I sopped up some of the dampness and tucked the 'glass inside the wrap, and tied the outer sheath firmly down around the duct with a clear half-inch gap between it and the wood. Then I stuck a light bulb underneath the whole mess and left it on for a couple of days to try and dry out what I could. Remember those incandescents? They're useful little spot heaters sometimes. The bare plywood also clearly needed some urethane or something to make it more water-resistant, because in winter this duct would always be cold and wanting to form condensation right where it comes inside. Shoulda thought of that when building the pass-throughs, huh? Dealing with all of this would have to wait until I didn't have to ventilate for some long period of time, e.g. when I could have windows open. I floated a sort of best-practice question about ventilation-duct installation over at GBA and the best armchair suggestion was a larger hole and bedding the pipe in rings of impermeable spray-foam at the interior and exterior penetrations. | |
Less infrared fun
| Thinking more deeply about duct insulation let me realize that with the basement left to sit at cooler temps to reduce foundation loss, the heating ducts were emitting quite a bit of *radiant* heat when the system was running and thus delivering a little less supply-air temp upstairs while probably warming the basement more than I wanted. Perhaps it would be worth insulating most of the supply runs after all. And I had about a sheet and a half of half-inch foil-face polyiso left from construction. What better solution to block radiant loss? | |
|
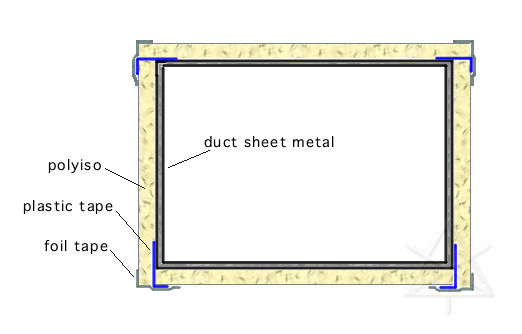
However, this needed a little bit of advance engineering.
I'd use foil tape to close the joints, but the first few internal support points needed to *not* be thermal bridges to the ducts themselves. I had a small amount of the mega-sticky Weathermate tape left over, which would be perfect for the first attachments to keep the stuff in place because the foam pieces basically weigh nothing anyway. |
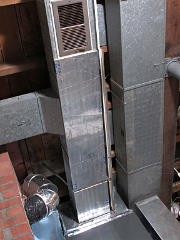
| It was a little fiddly cutting pieces to fit with minimal waste and working them into place around some of the supports, but it went together fairly precisely. |
_H* 130325